Posts

BioSyent Releases Results for Q1 2018

Image
TORONTO, May 30, 2018 (GLOBE NEWSWIRE) -- BioSyent Inc. (“BioSyent”) (TSX Venture:RX) released today a summary of its financial results for the three months ended March 31, 2018. Key highlights include: First quarter (Q1) 2018 Net Revenues of $4,447,147 increased by 16% versus Q1 2017 Q1 2018 Canadian Pharmaceutical Net Revenues of $3,765,638 increased by 12% versus Q1 2017 and International Pharmaceutical Net Revenues of $565,841 increased by 90% versus Q1 2017 Q1 2018 EBITDA 1 of $1,477,767 increased by 24% versus Q1 2017 Q1 2018 Net Income After Tax (NIAT) of $1,143,130 increased by 27% versus Q1 2017 Q1 2018 NIAT percentage to Net Revenues of 26% compares to 24% in Q1 2017 Q1 2018 Fully Diluted EPS of $0.08 was $0.02 higher than Q1 2017 Fully Diluted EPS of $0.06 Fully Diluted EPS for the Trailing Twelve Months ended March 31, 2018 was $0.38 as compared to $0.29 for the Trailing Twelve Months ended March 31, 2017 As at March 31, 2018, the Company had cash, cash equivalents,

BioSyent Releases Results for Fourth Quarter and Full Year 2017

TORONTO, March 21, 2018 (GLOBE NEWSWIRE) -- BioSyent Inc. (“BioSyent”) (TSX Venture:RX) released today a summary of its financial results for the three and twelve months ended December 31, 2017. Key highlights include: Fourth quarter (Q4) 2017 Net Revenues of $5,901,488 increased by 18% versus Q4 2016 Full Year (FY) 2017 Net Revenues of $20,762,755 increased by 16% versus FY 2016 Q4 2017 Canadian Pharmaceutical Net Revenues of $4,937,297 increased by 12% versus Q4 2016 and International Pharmaceutical Net Revenues of $868,917 increased by 75% versus Q4 2016 FY 2017 Canadian Pharmaceutical Net Revenues of $16,856,703 increased by 12% versus FY 2016 and International Pharmaceutical Net Revenues of $2,476,902 increased by 60% versus FY 2016 Q4 2017 EBITDA 1 of $1,961,159 increased by 23% versus Q4 2016 FY 2017 EBITDA 1 of $6,910,977 increased by 17% versus FY 2016 Q4 2017 Net Income After Tax (NIAT) of $1,457,228 increased by 33% versus Q4 2016 FY 2017 NIAT of $5,206,277 incr

Bought Linamar (LNR.TO)

Image
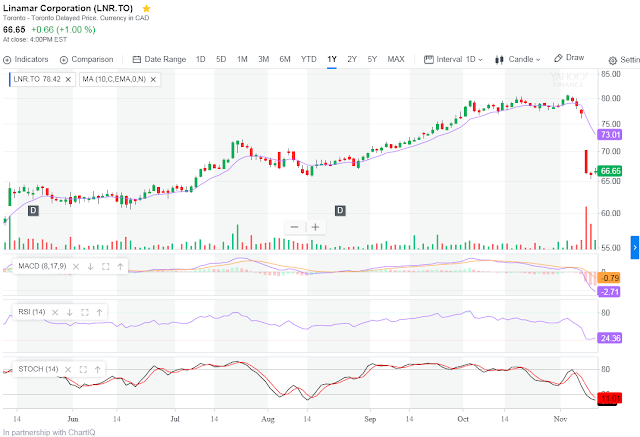
Price today closed at $66.65. I waited a day or two after the stock went down 13.88% on Wednesday to see if it will still go down. Charts using MACD, RSI and Stocastics show oversold. I'm not an expert in looking at charts so I'm just guessing here. The stock opened at $66.43 on Nov 10, 2017 and went as high as $67.14. I was thinking whether I should buy it or not. Near closing, it hovered around $66.70 to $66.75. I put a limit order of $66.72 when it was at $66.75 but didn't get filled for about 3 minutes, then it got filled and closed the day at $66.65. Did not really follow the 3 technical indicators as outlined in Rule 1 Investing which was probably a mistake. Linamar Delivers Another Quarter of Solid Earnings, Cash Flow and New Business Wins November 7, 2017 GUELPH, ON, Nov. 7, 2017 /CNW/ - (TSX: LNR.TO - News ) Sales increase 6.5% over the third quarter of 2016 ("Q3 2016") to reach $1.55 billion ; Net Earnings before non-recu

Biosyent Q1 2017 Results

Image
TORONTO, ONTARIO--(Marketwired - May 25, 2017) - BioSyent Inc. ("BioSyent") (TSX VENTURE:RX) released today a summary of its financial results for the three months ended March 31, 2017. Key highlights include: First quarter (Q1) 2017 Net Revenues of $3,821,262 increased by 1% versus Q1 2016 Q1 2017 Pharmaceutical Net Revenues of $3,652,834 increased by 3% versus Q1 2016 with Canadian Pharmaceutical Net Revenues of $3,354,697 increasing by 2% versus Q1 2016 and International Pharmaceutical Net Revenues of $298,137 increasing by 17% versus Q1 2016 Q1 2017 EBITDA 1 of $1,191,324 decreased by 6% versus Q1 2016 Q1 2017 Net Income After Tax (NIAT) of $901,556 decreased by 5% versus Q1 2016 Q1 2017 NIAT percentage to Net Revenues of 24% compares to 25% in Q1 2016 Q1 2017 Fully Diluted EPS was $0.06 as compared to $0.07 in Q1 2016 Trailing Twelve Months Fully Diluted EPS was $0.29 for the twelve months ended March 31, 2017 as compared to $0.26 for the twelve months en