Bought Linamar (LNR.TO)
Price today closed at $66.65. I waited a day or two after the stock went down 13.88% on Wednesday to see if it will still go down. Charts using MACD, RSI and Stocastics show oversold. I'm not an expert in looking at charts so I'm just guessing here.
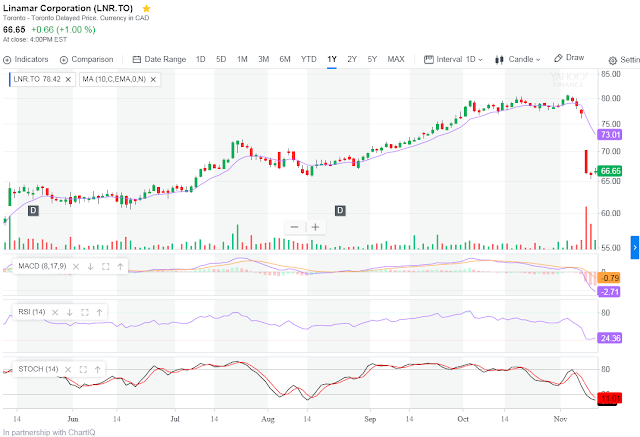
The stock opened at $66.43 on Nov 10, 2017 and went as high as $67.14. I was thinking whether I should buy it or not. Near closing, it hovered around $66.70 to $66.75. I put a limit order of $66.72 when it was at $66.75 but didn't get filled for about 3 minutes, then it got filled and closed the day at $66.65.
Did not really follow the 3 technical indicators as outlined in Rule 1 Investing which was probably a mistake.
Linamar Delivers Another Quarter of Solid Earnings, Cash Flow and New Business Wins
- Sales increase 6.5% over the third quarter of 2016 ("Q3 2016") to reach $1.55 billion;
- Net Earnings before non-recurring items and foreign exchange impacts1 increased 9.2% and Net Earnings per Share before non‑recurring items and foreign exchange impacts1 increased 9.4%;
- Continued business wins maintains strong launch book at nearly $4.7 billion;
- Powertrain/Driveline segment growth despite vehicle production declines in the North American Market driven by launches; and
- Industrial segment has another quarter of double digit sales growth that exceeded market growth through continued market share gains in booms and telehandlers.
Three Months Ended
|
Nine Months Ended
| ||||
September 30
|
September 30
| ||||
(in millions of dollars, except earnings per share figures)
|
2017
|
2016
|
2017
|
2016
| |
$
|
$
|
$
|
$
| ||
Sales
|
1,549.7
|
1,455.5
|
4,971.9
|
4,630.8
| |
Operating Earnings (Loss) 2
| |||||
Powertrain/Driveline
|
108.1
|
124.2
|
416.0
|
429.1
| |
Industrial
|
33.8
|
39.7
|
133.6
|
120.6
| |
Operating Earnings (Loss)
|
141.9
|
163.9
|
549.6
|
549.7
| |
Net Earnings (Loss)
|
107.3
|
122.2
|
414.3
|
406.0
| |
Net Earnings (Loss) per Share – Diluted
|
1.62
|
1.86
|
6.27
|
6.16
| |
Operating Highlights
Sales for the third quarter of 2017 ("Q3 2017") were $1,549.7 million, up $94.2 million from $1,455.5 million in Q3 2016.
Sales for the Powertrain/Driveline segment ("Powertrain/Driveline") increased by $62.0 million, or 5.1% in Q3 2017 compared with Q3 2016. The sales increase in Q3 2017 was impacted by:
- additional sales from launching programs in Europe, Asia and North America;
- increased volumes from our light vehicle automotive customers in Europe and on select programs in North America; and
- additional sales from our on- and off-highway vehicle customers; offset by
- lower volumes resulting from significant volume declines in the North American light vehicle market down 7.7%; and
- an unfavourable foreign exchange impact from the changes in foreign exchange rates.
The Industrial segment ("Industrial") product sales increased 14.1%, or $32.2 million, to $260.3 million in Q3 2017 from Q3 2016. The sales increase was due to:
- strong market share gains and increased volumes for booms in North America, Europe and Asia;
- strong market share gains and increased volumes for telehandlers in North America; and
- market share gains in scissors in Asia; offset by
- unfavourable changes in foreign exchange rates.
The Company's operating earnings for Q3 2017 were $141.9 million. This compares to $163.9 million in Q3 2016, a decrease of $22.0 million.
Q3 2017 operating earnings for Powertrain/Driveline were lower by $16.1 million, or 13.0% over Q3 2016. The Powertrain/Driveline segment's earnings were impacted by the following:
- production volumes increasing on launching programs in Europe, Asia and North America;
- increased volumes from our light vehicle automotive customers in Europe and on select programs in North America; and
- on- and off-highway vehicle volume increases; offset by
- the non-recurring net recovery related to the premature ending of customer contracts in Q3 2016;
- an unfavourable foreign exchange impact from the revaluation of the operating balances on the balance sheet in Q3 2017 in comparison to a favourable impact in Q3 2016;
- reduced earnings resulting from the foreign exchange impact from unfavourable changes in foreign exchange rates;
- unfavourable product mix resulting from the North American automotive market decline's impact on higher margin mature programs inadequately offset by the lower margins on programs in the early stages of launch; and
- increased management and sales costs supporting growth.
___________________________________________
|
1 Net Earnings (Loss) and Net Earnings (Loss) per Share before non-recurring items and foreign exchange impacts are Non-GAAP measures used to provide useful information to readers to asses the financial performance and financial condition of the Company. These measures do not have a standardized meaning prescribed by GAAP and therefore they are unlikely to be comparable to similarly titled measures presented by other publicly traded companies, and should not be construed as an alternative to other financial measures determined in accordance with GAAP. Net Earnings (Loss) and Net Earnings (Loss) per Share before non-recurring items and foreign exchange impacts have been adjusted from Net Earnings (Loss) and Net Earnings (Loss) per Share by the non-recurring net recovery related to the premature ending of customer contracts in Q3 2016, the non-recurring future tax rate reduction on deferred tax assets in Q3 2017, the foreign exchange impacts from the changes in foreign exchange rates, and the foreign exchange impact from the revaluation of the operating balances.
|
2 For more information refer to the section entitled "Non-GAAP and Additional GAAP Measures" in the Company's separately released MD&A.
|
Industrial segment operating earnings in Q3 2017 decreased $5.9 million, or 14.9% from Q3 2016. The Industrial operating earnings results were predominantly driven by:
- net increase in volumes; offset by
- an unfavourable foreign exchange impact from the revaluation of the operating balances on the balance sheet in Q3 2017 in comparison to a favourable impact in Q3 2016;
- lower margins as a result of changes in customer and product mix favouring new launching products with lower margins;
- an unfavourable foreign exchange impact from the changes in foreign exchange rates; and
- increased management and sales costs supporting growth.
"We have had another strong quarter at Linamar despite soft North American vehicle markets," said Linamar CEO Linda Hasenfratz. "Launches are driving sales up in the Powertrain/Driveline segment to more than offset a down North American market and earnings will of course follow. Our Industrial segment continues to power along taking market share and is surpassing industry growth levels. We continue to generate cash to position ourselves positively for future growth and continue to see new business wins at a blistering pace."
Dividends
The Board of Directors today declared an eligible dividend in respect to the quarter ended September 30, 2017 of CDN$0.12 per share on the common shares of the Company, payable on or after December 8, 2017 to shareholders of record on November 24, 2017.
On Nov. 8, 2017. Stock price dropped 13.88% due to comparison from 3 months ended Sep 30, 2017 compared to same period in 2016.

On Nov. 2, 2017, LNR.TO hit a high of $80.46.
Linamar was founded by Frank J. Hasenfratz and is now the Chairman of the Board. His daughter Linda S. Hasenfratz has taken over as CEO since August 2002 and aside from the 2008-2009 financial crisis, the earnings and stock has been consistently growing.
Share ownership
Shares outstanding as of Sep 30, 2017 - 65,331,095
Share closing price as of Nov 10, 2017 - $66.65
Frank J. Hasenfratz - Chairman of the Board - 15,295,643 - 23.4% - $1,019,454,605
Linda Hasenfratz - CEO - 3,924,747 - 6% - $261,584,387
Combined, the Hasenfratz family owns almost 29.4% of the company so their net worth is tied closely to the company.
The Good
Using Future P/E of 11.9 which is the historical P/E for this company and 15% target return. Intrinsic value/Sticker Price is $165.31. Margin of Safety (MOS) price is half so $82.66. It is selling well below MOS price.
Caveat
Current P/E is at 8.2 and forward P/E estimate is 7.5. If we were to use 7.5 as the future P/E. Sticker price is $93.25 and MOS or half of that price is $46.62. 75% of sticker price is $69.93.
Magic Formula
Return on Capital is 24.65%.
Earnings Yield is 11.91%
On Nov. 8, 2017. Stock price dropped 13.88% due to comparison from 3 months ended Sep 30, 2017 compared to same period in 2016.

On Nov. 2, 2017, LNR.TO hit a high of $80.46.
Linamar was founded by Frank J. Hasenfratz and is now the Chairman of the Board. His daughter Linda S. Hasenfratz has taken over as CEO since August 2002 and aside from the 2008-2009 financial crisis, the earnings and stock has been consistently growing.
Share ownership
Shares outstanding as of Sep 30, 2017 - 65,331,095
Share closing price as of Nov 10, 2017 - $66.65
Frank J. Hasenfratz - Chairman of the Board - 15,295,643 - 23.4% - $1,019,454,605
Linda Hasenfratz - CEO - 3,924,747 - 6% - $261,584,387
Combined, the Hasenfratz family owns almost 29.4% of the company so their net worth is tied closely to the company.
The Good
- Except for the current quarter, earnings have been steadily growing since 2009.
- Book value is up in current quarter and steady growth since 2009 at 17.48% per year
- FCF growth since 2013.
- Revenue and EPS growth in the last 5 years averages over 15% per year.
- Low debts at Debt/Equity ratio at 0.49 and current ratio of 1.95 and quick ratio of 1.39.
- Long term debt payable in 2.51 years with earnings.
- Canada's 2nd largest manufacturer of auto parts.
- Can be cyclical as auto sales goes down when economy goes down.
- Currently near top of credit cycle
- Latest 3Q earnings below year ago for same period could signal slowdown in auto sales or economy so we could see stock go down even more
- Could be hurt by foreign exchange rate and oil price increase because auto sales could slow down.
- Depending on their execution of their strategies, electric car revolution could reduce areas where they can supply parts since electric cars need fewer parts.
Using Future P/E of 11.9 which is the historical P/E for this company and 15% target return. Intrinsic value/Sticker Price is $165.31. Margin of Safety (MOS) price is half so $82.66. It is selling well below MOS price.
Caveat
Current P/E is at 8.2 and forward P/E estimate is 7.5. If we were to use 7.5 as the future P/E. Sticker price is $93.25 and MOS or half of that price is $46.62. 75% of sticker price is $69.93.
Magic Formula
Return on Capital is 24.65%.
Earnings Yield is 11.91%


Comments